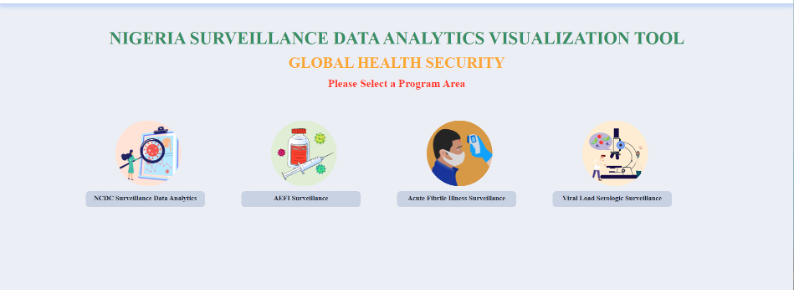
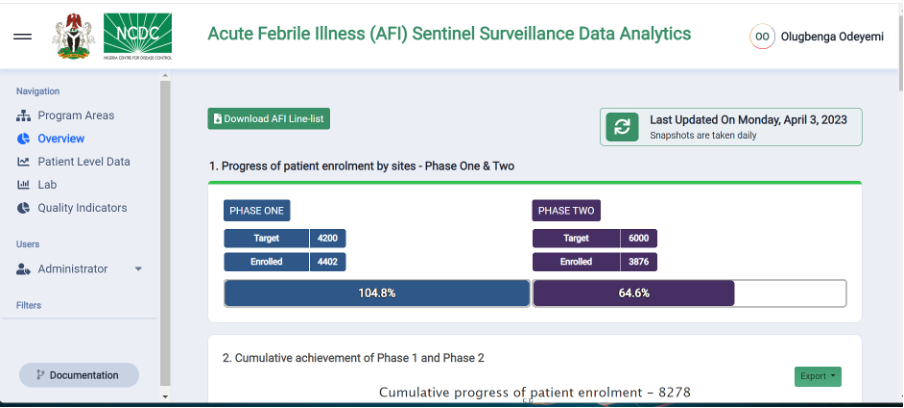
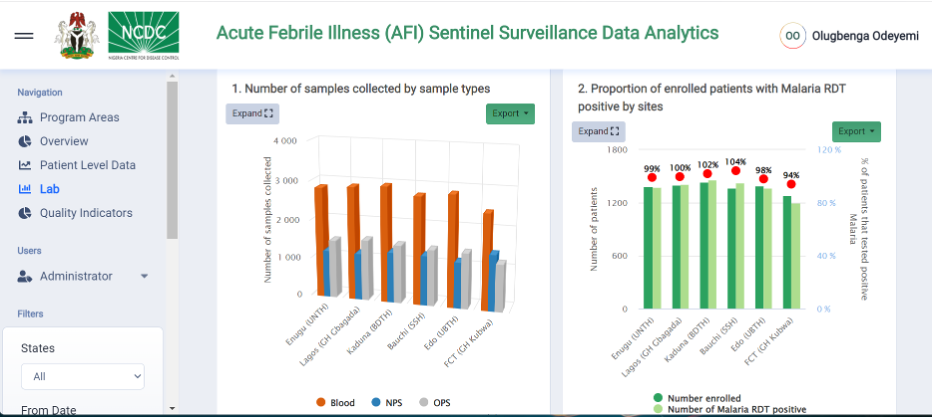
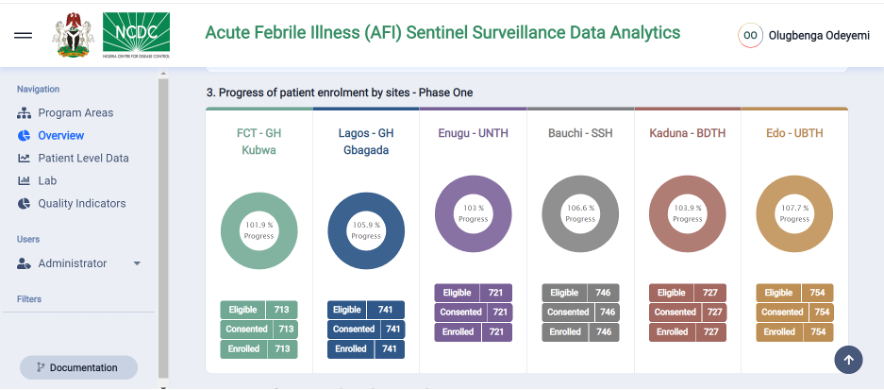
The Data Analytics Visualization Tool (DAVT) was developed as part of the secureNigeria health surveillance project, a USCDC funded initiative by the University of Maryland, Baltimore (UMB) and the Institute of Human Virology Nigeria (IHVN). The analytical dashboard was designed to support surveillance and response at the National Centre for Disease Control (NCDC) and State Public Health Emergency Operation Centres (PHEOCs).

The development of the DAVT was built on the successes of Nigeria's Integrated Disease Surveillance and Response (IDSR) Program, which uses the Surveillance Outbreak Response Management and Analysis System (SORMAS) for reporting new cases of epidemic-prone diseases, detecting outbreaks, and managing them. The DAVT also utilizes the Mobile Strengthening Epidemic Response Systems (mSERS) for aggregate epidemic-prone disease reporting.

The DAVT dashboard integrates data from these surveillance reporting platforms, allowing stakeholders to visualize, analyze and make informed decisions. It also facilitates process improvement activities in data quality management. While currently pulling data from SORMAS and mSERS, the dashboard is designed to integrate with other surveillance reporting platforms in the future.
The DAVT currently displays analytics for three prioritized diseases (COVID-19, Cerebrospinal Meningitis & Lassa fever) from SORMAS and three priority diseases (Typhoid fever, Malaria & diarrhea with dehydration) from the mSERS database. The goal is to expand to other targeted diseases within the current fiscal year.

By integrating surveillance data into the PHEOC response system, the DAVT simplifies the data demand and use process, making data readily available for real-time use. This tool sensitizes Nigeria's surveillance system, improving response and decision-making during disease outbreaks.

